Spot On Performance
  • How SOP Works
  • E-Ticketing
  • Apps
  • About Us
  • Log In
  • How SOP Works
  • E-Ticketing
  • Apps
  • About Us
  • Log In
Popular Search reportreporviewsunloadnew

Getting Started

  • Mobile Apps
  • Job Search
  • Navigating Work Shifts
  • SOP’s Dashboard
  • Accessing SOP

E-Ticketing

  • Notes and Pictures
  • Quality Control
  • E-Ticket Reporting

Delivery Management

  • Location and Targets
  • Interactive Unloading
  • Truck Time Cards
  • Load Uses

Material Hauling

  • Material Haul Scheduling
  • Loading
  • Interactive Unloading

Managers

  • Load QC Reporting
  • Backhaul Scheduling
  • Job Setup and Details
  • Job Shift Settings
  • Job Access
  • Production Scheduling
  • Truck Dispatch
  • User Management
  • User Roles
  • Activity Report
  • Performance & Dwell Report
  • Time Report
  • Quality Control Report
  • System Reports

Administrators

  • Carrier Management
  • Truck Management
  • System Settings
  • Home
  • Training
  • Construction
  • Managers
  • Activity Report

Activity Report

Table of Contents
  • Overview
  • Accessing the Activity Report
  • Quick Statistics
  • Tons Per Hour

Overview

SOP offers users the ability to access and view shift reports during ongoing or recently closed shifts.


Accessing the Activity Report

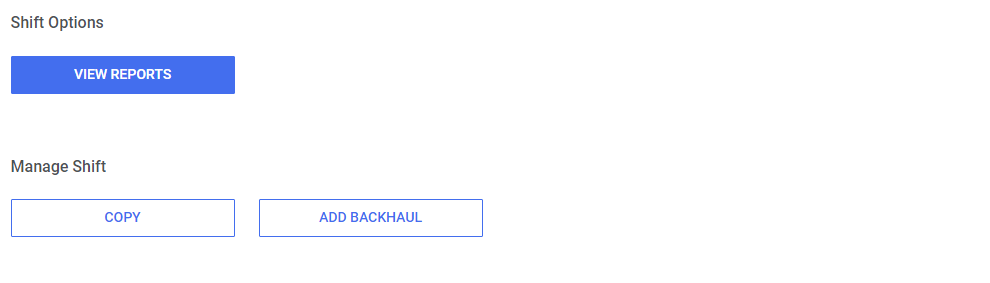
To access the activity report, follow these steps after viewing a shift: Scroll down to the ‘Shift Options’ section at the bottom and click the ‘View Reports’ button. Alternatively, if available, use the ‘Reports’ button in the top navigation menu.

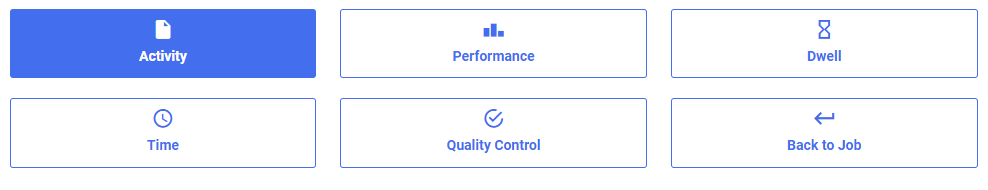
From here, users can click the ‘Activity’ navigation button to access the report.


Quick Statistics

Upon accessing the activity report, users will find two sections that provide a convenient summary of load and shift activity. These sections display the number of loads, notes, and quality control (QC) readings made during the shift. Additionally, users can easily access the quality control report by clicking the ‘Quality Control Report’ button.

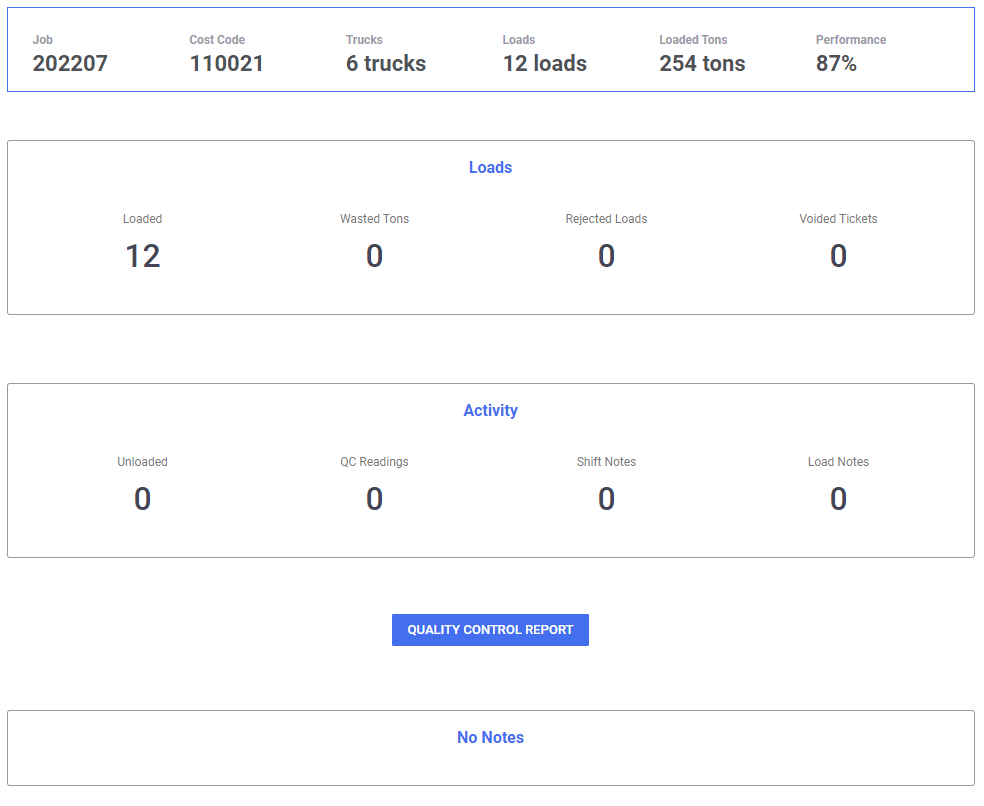
If there are any notes added, they will show here as well.
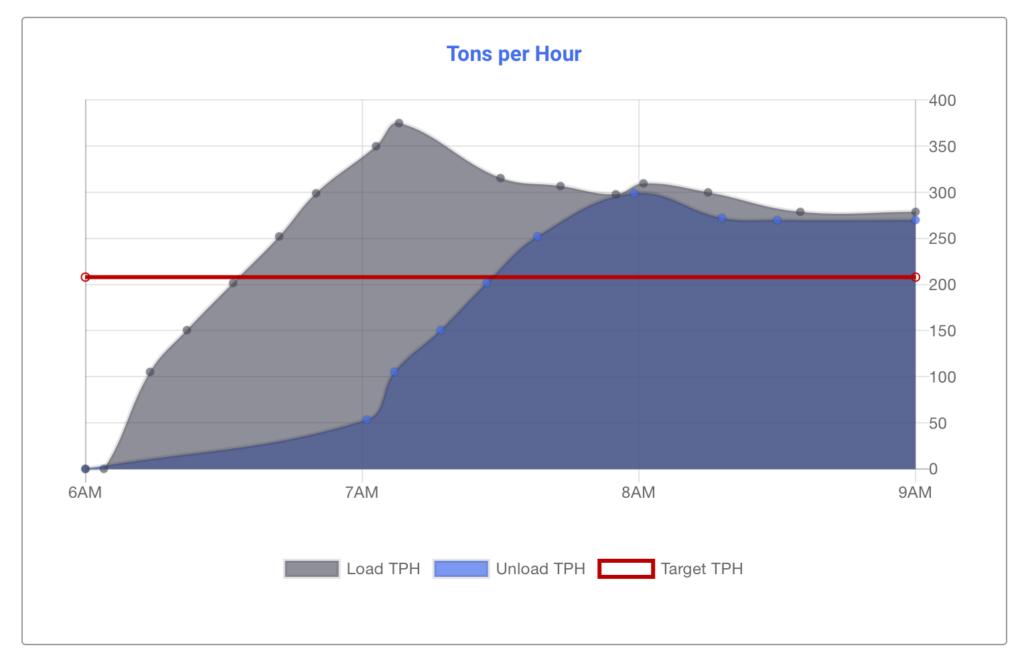

Tons Per Hour

In addition to the activity statistics mentioned above, SOP provides a detailed graph that illustrates the load and unload tons per hour (TPH) in comparison to the shift’s target TPH (if set). The graph’s X-axis represents the shift’s start time to the current time or end time, while the Y-axis displays the tonnage.

By utilizing these features, users can gain valuable insights into shift performance and track progress effectively.

More Questions? Contact Us!

How can we help?

Updated on June 7, 2023
User RolesPerformance & Dwell Report
Table of Contents
  • Overview
  • Accessing the Activity Report
  • Quick Statistics
  • Tons Per Hour
Facebook Linkedin Youtube

CONTACT

  • 5237 Summerlin
    Commons Blvd #114
    Fort Myers, FL 33907
  • 239-307-2977
  • [email protected]

INFO

  • Home
  • E-Ticketing
  • Apps

HELP

  • Schedule a demo
  • Training
  • Support

COMPANY

  • About Us
  • Careers

Copyright 2018-2023. Spot On Performance, Inc.